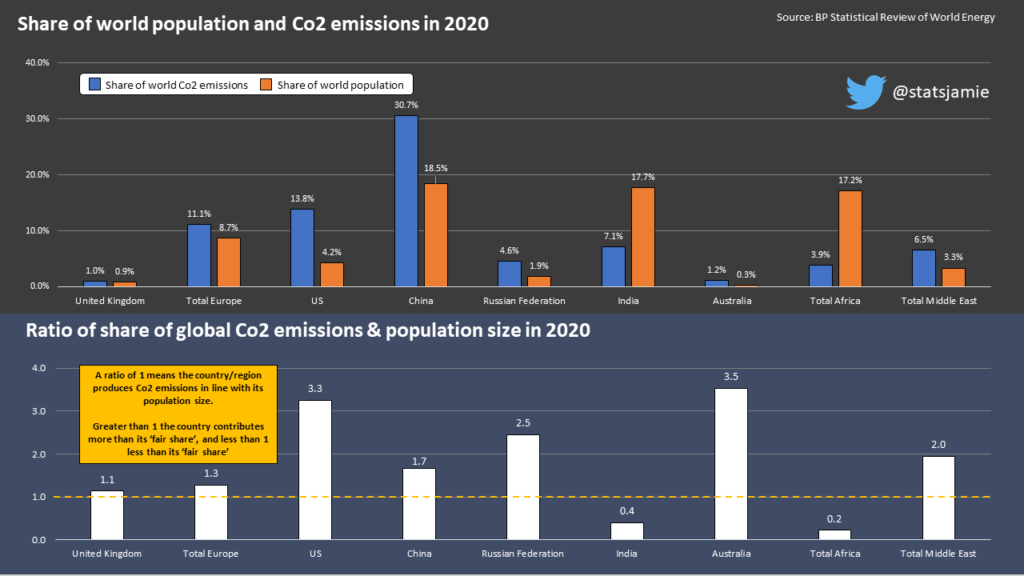
China emits 30% of global Co2 emissions up from 5% in 1965
The war in Ukraine and the reliance of many countries on commodities from Russia for energy have reopened the debate on energy security. This goes along with the increasing prominence of reducing Co2 emissions as countries pledge to hit net zero. The UK Government has launched its new energy strategy with a target that 95% of Britain’s electricity will come from nuclear and renewables by 2030. This will help reduce emissions, but at what cost? Currently, the UK contributes 1% to global carbon dioxide emissions, while in contrast, China emits 30% of the world’s Co2, up from just 5% in 1965.
Coal powering the Chinese economy and fuelling the world emissions
Back in 1965, while China had 22% of the world’s population, it consumed less energy than the UK, which was just 1.6% of the population. But decades of rapid economic growth have led to a dramatic expansion in China’s energy needs. China is now the world’s largest consumer of energy, the largest producer and consumer of coal, and the largest emitter of carbon dioxide. In 1965, China contributed 4.4% to the world’s Co2 and rapid expansion in coal use has seen this rise sixfold to 30.6% in 2020. Over the same period, we have seen a decline in China’s share of the world’s population.
While the UK has reduced reliance on coal for cleaner energy, which has come at an economic cost for consumers, this reduction is a fraction of the extra use of coal globally over the past half-century. Since 1965 the UK has cut coal use by 96% but globally the amount of coal burned for energy has increased by 300%, driven by China. It used 8% of the world’s coal in 1965, but by 2020 this proportion had increased to 54%.
The United States emits three times as much Co2 per head as the UK
The United States emits 13.8% of the world's carbon dioxide but has just 4.2% of the population, so a ratio of 3.3 times over what you would expect if every country emitted in line with population size. Despite being the world's largest polluter of Co2, China has a lower ratio at 1.7, indicating that per head of population the US is almost twice as bad as China. The UK emits carbon dioxide in line with population size while India and Africa have relatively low emissions of Co2 in relation to population size.
Australia is one of the world's worse emitters of carbon dioxide when accounting for population size with high reliance on coal for energy. It has a higher ratio than the US at 3.5.
Conclusion
The UK Government’s new energy strategy has set a target for more renewables and a target to get to net zero carbon emissions by 2050. Domestic fuel bills already include a green levy on bills that is an average of just over £150 per month. These levies are used to support incentives for renewable energy and subsidies for energy efficient measures. With the current cost of energy for domestic households at the moment and with renewables already a significant footprint in electricity production, surely it is time to remove the subsidies?
If the UK got to net zero overnight, it would make negligible difference to world Co2 emissions, in particular if countries such as China continue to produce and use coal to fuel its economy. China used more coal in 2020 than the UK has in every year since 1978. Hitting consumers in the pocket at the time while costs are rising is not the way to go.
Follow me over on Twitter, Gettr, Instagram, or Facebook for my daily updates or read my recent blog looking at how Covid vaccines in children would require 4 million doses to prevent 1 ICU admission.


